10 of the Top Business Intelligence Tools for B2B SaaS
Last updated: February 22nd, 2024
If you feel like you’re in a constant battle to connect the dots between your marketing efforts and tangible business results, it’s time to cut through the noise.
As a marketing operations leader looking to enhance your B2B SaaS marketing analytics and data visualization, you know that the right BI tool can transform your scattered data into a clear, compelling story that not only makes sense to you but also resonates with the budget holders.
But with so many BI tools available on the market, which of them are the best for B2B SaaS businesses specifically? Today, we want to share our 10 favorites.
Many of them have powerful analytics capabilities, along with striking yet simple data visualization options. So, stop wasting marketing dollars and endless hours stitching together reports, and take a look at our curated selection of the best B2B SaaS marketing business intelligence tools.
Databox
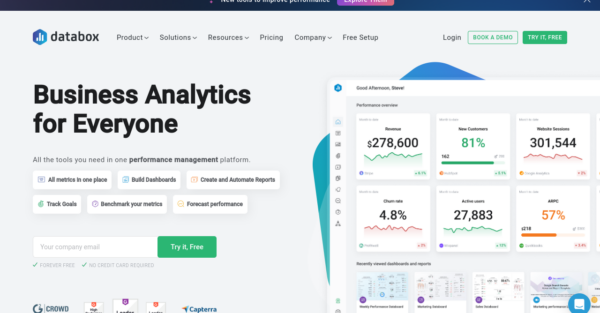
Databox is an easy-to-use, all-in-one BI tool that produces aesthetically appealing dashboards and data visualizations. You can process all your data, monitor KPIs, and automatically generate performance scorecards. What’s even better is that you can white-label all your dashboards or databoards for a more professional look.
Features and functionality include:
- Integrate and connect all the tools you use
- Drag-and-drop metric builder for any data type
- Automate KPI scorecards
- Design your own dashboard or use a pre-designed template
- Have business insights delivered directly to your inbox or mobile device
Pricing
Databox has four paid pricing plan options (Professional for $137/month, Growth for $319/month, and Premium for $799/month) and one free plan. All plans allow you to pay an additional $4.80/month for each extra data source.
Tableau
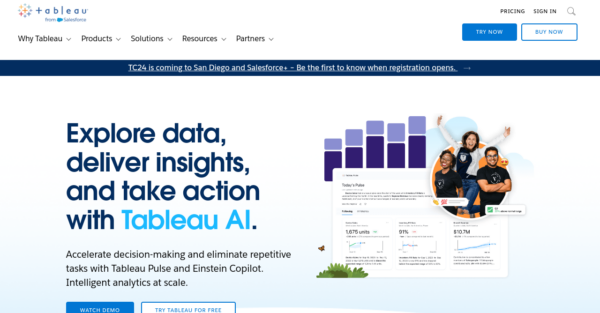
Tableau is an intuitive BI tool developed by Salesforce. Its user-friendly interface and powerful processing capabilities make it a favorite among B2B SaaS BI tools. Their AI tool, Einstein, can analyze data faster and pluck out useful insights whilst also creating high-quality predictive models. It’s end-to-end encrypted, so all your business and customer data is secured. high-quality predictive models.
Features and functionality include:
- A simple drag-and-drop interface
- Collaborate and share dashboards and data with anyone
- Run it from a desktop, the cloud, or a server of your choice
- Access AI-driven predictive models
- Powerful data analytics
Pricing
There are three pricing plans – Viewer for $15/month/user, Explorer for $42/month/user, and Creator for $75/month/user. The different plans actually relate to license types and hosting locations.
HockeyStack
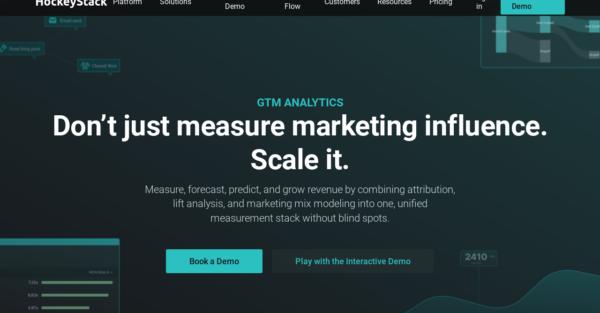
HockeyStack gives you the functionality to collect, measure, analyze, and, most importantly, take actionable steps with the business intelligence data you have. It’s super easy to use, quick to get started, and is a totally codeless solution.
Features and functionality include:
- Connect all your tools easily
- A variety of dashboard templates to use
- Develop your own customer feedback surveys
- Make use of a variety of modeling tools
- Build your own reporting metrics
- Use a budget simulator for accurate forecasting
Pricing
HockeyStack offers two pricing plans (Growth for $1,399/month and Scale for $2,400/month) and a custom enterprise-level plan. The enterprise plan can be customized to include or exclude particular features.
Dreamdata
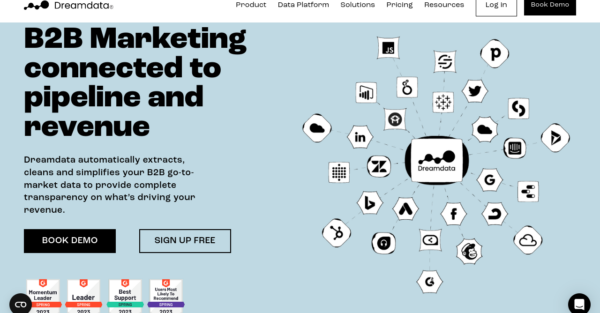
Dreamdata makes business optimization easy by automatically extracting and cleaning data from your various data sources. It has neat collaboration tools that enable your whole team to access centralized data and work together. Dreamdata has advanced tracking features that are a real standout, allowing you to follow leads through the sales pipeline.
Features and functionality include:
- Actionable insights sent directly to your inbox
- Measure account-based metrics
- GDPR compliant
- Set up custom KPIs
- Receive detailed customer profiles
- Analyze content performance
Pricing
Dreamdata have two regular pricing plans (Team for $599/month and Business for $1,499/month), a customized enterprise plan, and a free plan.
Looker
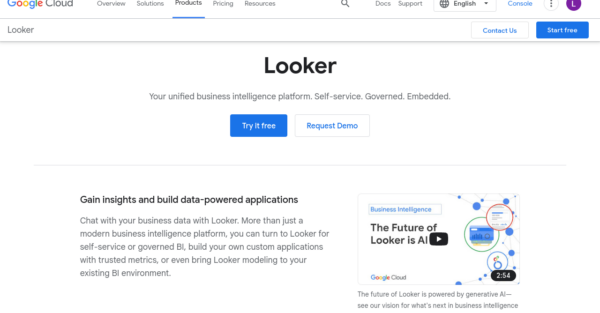
Looker, which is part of the Google suite of services, gives you the ability to collect, explore, and analyze all your data in one convenient place.
Features and functionality:
- LookML, a powerful professional data modeling tool
- Integration with Looker Studio for informative reports
- Plenty of learning materials and instructional resources
- The ability to embed visualizations and analytics directly into websites
- Easy collaboration
Pricing
Looker pricing is broken into two components. You have to pay for both the platform and individual user access.
Platform Pricing
- Standard access for $5,000/month
- Enterprise and Embed access: you’ll have to speak to sales directly for prices
User Access Pricing
- Viewer for $30/user/month
- Standard for $60/user/month
- Developer for $125/user/month
Power BI
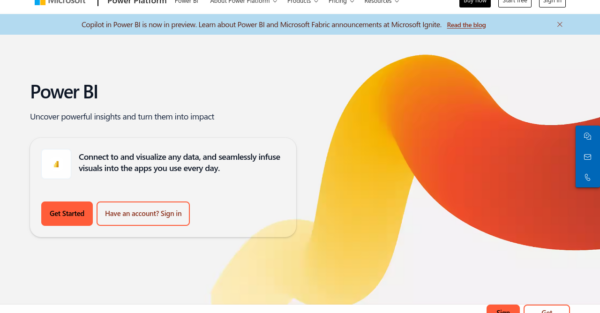
Power BI is a powerful and user-friendly Microsoft product that can process large amounts of data. One of the standout features is the data visualization capabilities, while the publish-to-web function allows you to easily export visualizations to a website, email campaign, or social media account.
Features and functionality:
- Clean and transform your data for accurate analysis
- Use the Power BI mobile app
- Easily connects with other Microsoft tools
- Embed and share reports easily
- Utilize AI tools for deeper data analytics
- Build real-time dashboards
Pricing
Power BI has some really affordable pricing plans. You can use the platform for free or commit to one of the two regular paid plans (Power BI Pro for $10/user/month and Power BI Premium for $20/user/month) or the enterprise-scale plan (Power BI and Microsoft Fabric – customized pricing).
Sisense
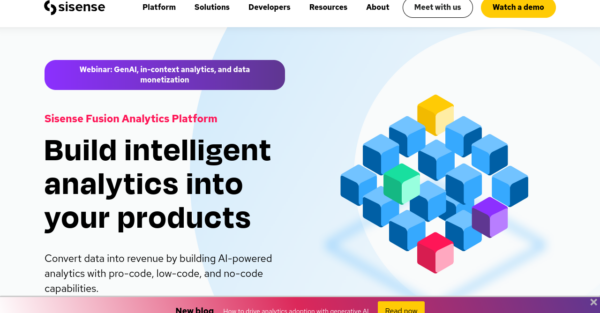
Sisense uses AI-powered analytics and your choice of low-code or no-code functionality. It’s ideal for those who need a powerful and highly scalable solution.
Features and functionality:
- Drag-and-drop interface
- Build native applications displaying your dashboards
- Customize your dashboards
- Include conversational chatbots for easy navigation
- Machine-learning-enhanced software detects data anomalies quickly
- Connect with a ton of different tools
Pricing
Unfortunately, there’s not a hint of pricing information on their website. Instead, they encourage you to schedule a demo or contact them directly to discuss your options.
Dataflo
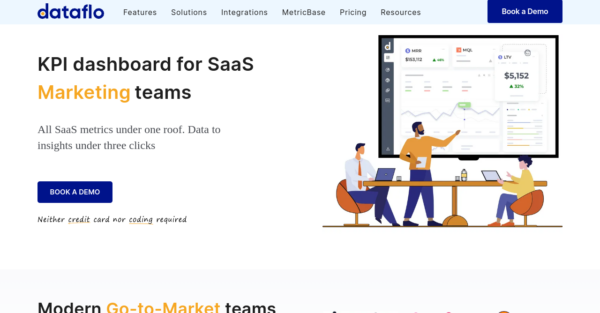
Dataflo is a slick dashboard and data visualization builder designed with simplicity in mind — all you have to do is connect your apps and it’s ready to start collating data.
Features and functionality:
- Custom build your dashboards
- Compatible with a wide range of tools and apps
- Assign team members accountable for different KPIs
- Automate reporting
- Works with Slack for team communication and collaboration
- Analyze customer behavior
Pricing
Dataflo two plans to choose from – Growth for $99/month and Premium for $199/month. Both plans give you unlimited user access and the ability to create an unlimited number of dashboards.
Zoho Analytics
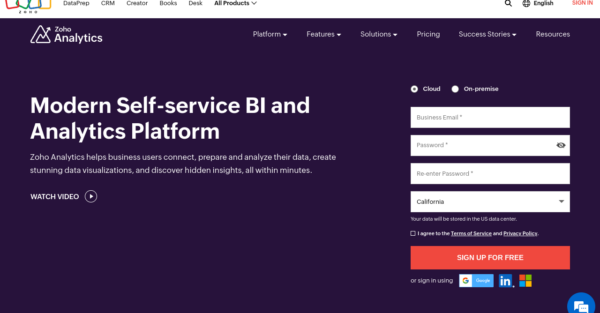
Zoho Analytics is a detailed business intelligence tool that enables you to bring together data from all aspects of business operations to highlight useful insights. Because the platform is incredibly user-friendly, you can easily create detailed analytics reports and visualizations.
Features and functionality:
- Upload data in a wide variety of formats
- Connect with all the additional apps you use
- Use the Smart-Cleanse tool to filter and clean data quickly
- Use AI-powered suggestions on all things from managing datasets to transforming it
- Create beautiful and engaging dashboards and visualizations
- Get the most out of your data with predictive analytics
Pricing
You can get started with Zoho either as a cloud-based or a server-based service, and pricing options vary depending on this choice.
Cloud-Based
- Basic plan for $24/month
- Standard plan for $48/month
- Premium plan for $115/month
- Enterprise plan for $455/month
Server-Based
- Free personal access: supports one user and 10,000 rows of data
- Professional local server from $30/user/month
Yellowfin BI
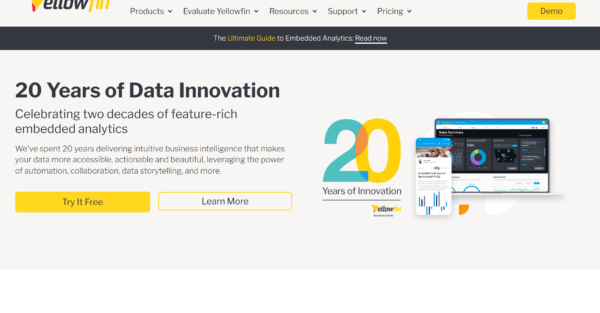
Yellowfin BI is the last of our all-encompassing business intelligence platforms. With this tool, you’ll get real-time analytics and trend predictions, all from the convenience of a mobile app or back at the office on a desktop.
Features and functionality:
- Create your dashboards using the intuitive drag-and-drop interface
- Set up alerts and thresholds for KPIs and other metrics
- AI-driven, automated data processing to monitor your business data
- Embed dynamic and interactive data into presentations and reports
- Create stunning data visualizations that include infographics and geospatial functionality
Pricing
Yellowfin BI pricing is based on your business revenue, usage, and number of users. So, you’ll have to submit a request for custom pricing based on your business needs.
Business Intelligence (BI) in a Nutshell
Business intelligence tools are used to collect, process, analyze, filter, and report on large business-related datasets. While analytics tools help you predict future trends, business intelligence tools help you understand the current performance of your business.
Business intelligence itself can be broken into several categories – data gathering, data analysis, and data visualization.
Data Gathering
The process of data gathering entails collecting data across various platforms and from different sources, whether that’s from customers, sales, or competitors. BI tools are used at this stage to help pull the required data from the sources and prepare it for analysis.
Data Analysis
Data analysis is when you crunch the numbers. These tools use algorithms and formulas to identify patterns and relationships in the data so you can make sense of it.
Data Visualization
Once you have all the numbers crunched and processed, you then have to present them in a logical way. BI tools will take your processed data and display it in charts, graphs, maps, or dashboards – basically any way that allows for easy information uptake.
Wrapping it All Up
Having a thorough understanding of your marketing attribution is fundamental to business development and growth. And with these BI tools, there’s no longer any excuse for not collecting the right data or not presenting it in easy-to-understand charts and reports.
However, another commonly missing element is a solid demand generation strategy. Tying in your BI data with your marketing strategy will give you the leg up you need to rise above the competition.
You can also see how your company compares to the competition in its current state with our SaaS scalability score self-assessment. It’s obligation-free and highly insightful, so feel free to check it out.
What you should do now
Whenever you’re ready…here are 4 ways we can help you grow your B2B software or technology business:
- Claim your Free Marketing Plan. If you’d like to work with us to turn your website into your best demo and trial acquisition platform, claim your FREE Marketing Plan. One of our growth experts will understand your current demand generation situation, and then suggest practical digital marketing strategies to hit your pipeline targets with certainty and predictability.
- If you’d like to learn the exact demand strategies we use for free, go to our blog or visit our resources section, where you can download guides, calculators, and templates we use for our most successful clients.
- If you’d like to work with other experts on our team or learn why we have off the charts team member satisfaction score, then see our Careers page.
- If you know another marketer who’d enjoy reading this page, share it with them via email, Linkedin, Twitter, or Facebook.