B2B SaaS Marketing Funnel Forecasting: Template Plus Walkthrough Example
Last updated: September 25th, 2023
When B2B SaaS companies don’t go through the effort of aligning their sales and marketing activity to the financial outcomes of the businesses they work for, it’s extremely difficult to show tangible value to budget holders.
This can cause issues with leadership amongst these organizations as CROs, CFOs, and CEOs speak in terms of sales, revenue, and cashflow– not marketing metrics like MQLs.
It’s not only the language of the reporting that’s important, but it’s also making sure that we’re building forecasts that accurately capture each point of leverage within an organization. For example, if you want to increase revenue by 50% in the next 12 months, then you might think it’s as simple as increasing leads by 50%.
However, it isn’t quite as straightforward as a company’s revenue isn’t exclusively impacted by leads.
Leads have to convert to MQLs, MQLs have to convert to opportunities, deals have to convert to customers and maintain a consistent ACV. A shift in any of these figures throws out your forecast.
Smart marketing isn’t just about increasing volume – it’s also about efficacy.
This lack of depth in forecasting makes it difficult to set achievable goals and strategically allocate your budget. You need to create a model that’s an accurate representation of the buyer’s journey, and properly document each point of leverage you can pull as a marketing professional.
Fortunately, a lot of these mis-alignments can be fixed with a better marketing funnel forecasting model. In this post, we’ll outline exactly how we help B2B SaaS companies build accurate marketing forecasting models so that they can better allocate budgets, set more realistic marketing goals, and achieve buy-in from check signers like CFOs.
If you’re not sure where to start with creating a marketing funnel forecast for your SaaS, reach out to us today for your Free Marketing Plan.
Why Most Marketing Funnel Forecasts Aren’t Useful
Most B2B SaaS marketing funnel forecasts fall apart because they don’t go deep enough into the buyer’s journey.
Most marketers simply focus on leads generated, but leads alone don’t capture the full impact you can make as a marketer.
In addition to generating leads, you can also improve lead to MQL conversion rates, align your targeting with the segments that turn into Closed Won, or have higher ACV than other segments.
You could even run a matched audience targeting campaign to prospects in your pipeline that educates them why your product or service is a better choice than a competitor’s product or service. You can also give converted customers content that shows them how to leverage the product more effectively so that they achieve better results, ultimately increasing the customer’s LTV.
Pulling any of these levers vastly improves the efficacy of your marketing funnel. This means that you’ll generate more revenue for every dollar you spend on marketing, which gives you an unfair advantage over your competitors as you’ll be able to spend more to acquire a customer.
The solution to create an accurate marketing funnel forecast is to analyze the entire sales and marketing funnel.
The good news is that it’s not too difficult to do so if you accurately track your numbers. Here’s a breakdown of the numbers that an effective B2B SaaS growth team should be tracking at a minimum:
Spend Metrics:
- Sales Spend: The amount of money you’ve spent on your sales department, including salaries, services, bonuses and software.
- Marketing Spend: The amount of money you’ve spent on your marketing department, including salaries, services, media and software.
Marketing Metrics:
- Traffic: The number of visitors your marketing site has received.
- Leads: The number of leads your business has generated.
- MQLs: The number of marketing qualified leads – a lead who marketing has judged as ready for sales – your business has generated.
Sales Metrics:
- Opportunities: The number of opened sales opportunities, or deals, that has opened.
- Pipeline: The forecasted annual recurring revenue – or whatever your primary payment term are – of those opportunities.
- Customers: The number of new customers that have been created.
- Won Revenue: The actual annual recurring revenue of those customers.
Revenue Metrics:
- Starting ARR: The annual recurring revenue you were generating from existing customers at the start of the period.
- New ARR: The additional recurring revenue that you are generating from customers created in this period.
- Expansion ARR: The additional revenue generated from existing customers expanding their accounts – adding seats or going up tiers.
- Churn ARR: Revenue that has been lost from existing customers leaving.
- Contraction ARR: Revenue that has been lost from existing customers downgrading their accounts or removing seats.
- End of Month ARR: The amount of revenue your organization expects to/is contracted to generate from its current cohort of customers over the next 12 months.
By taking an end-to-end funnel approach, your marketing funnel forecasts will closely match your financials. As a result, you’ll be able to identify and solve inefficiencies within your funnel, set more realistic goals, and allocate your budget more efficiently to maximize the ROI of your marketing efforts.
You’ll also have more productive conversations with your CFO and achieve buy-in more easily for various marketing efforts if you have sound data that matches their P&L.
So how do you actually create a marketing funnel forecast like the one above?
Many marketers assume it’s very complex to calculate all of the above mentioned metrics, but you only need a few sources: your marketing spend, your CRM data, and your revenue/cashflow data.
We regularly build marketing funnel forecasts for our clients, and in this post, we’ll outline our step-by-step process so that you can build your own marketing funnel forecast.
How We Create Accurate Marketing Funnel Forecasts
Below, we’ll walk you through the exact process we use to build accurate marketing funnel forecasts for our clients.
Note that as you’re building this out, it’s best to have at least six to twelve months of data to pull into your spreadsheet. The more data you can include, the more accurate your forecast will be.
Step 1: Collect Historical Sales & Marketing Performance
The first step to building your marketing funnel forecast is gathering all of the right metrics, sanitizing them, and confirming that the data matches your financials.
First, pull together all your sales and marketing metrics. Most of these will be found in your CRM or marketing automation platform. Using a tool like Hubspot or Salesforce definitely helps here, and in most cases, our clients already are – although the adherence to good data governance varies.
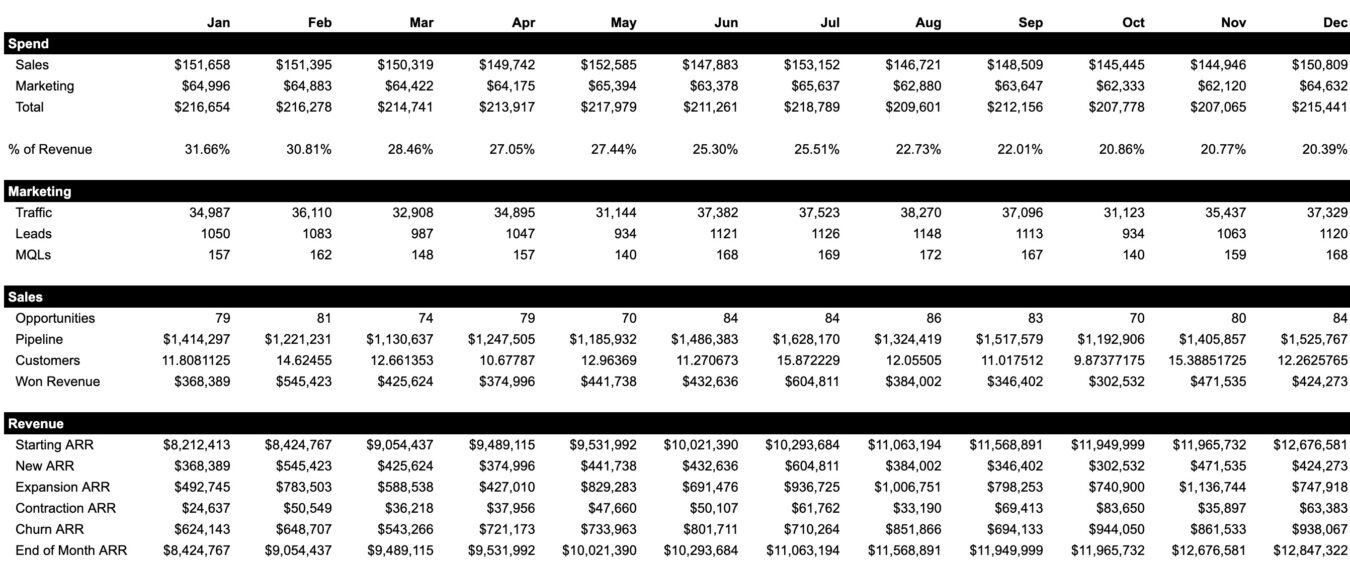
Go back through your data and pull-out your performance, preferably backdated for at least 12 months. Once you’re finished, your sheet should look something like this:

It’s important to have excellent data governance and marketing operations so you can confidently pull these numbers. Without excellent marketing operations, you won’t have access to accurate data.
If you don’t have confidence in your numbers, it will feel impossible to accurately forecast your marketing.
If you don’t have great marketing operations, we can help you build out an effective system so that you have access to accurate data.
Do you need help improving your marketing and revenue operations functions? Learn more about how we use HubSpot with our clients, or to connect with our team to review your current stack.
Step 2: Collect Key SaaS Revenue Metrics
Next, you’re going to need your top-level SaaS revenue metrics. If you’re not sure where to start, you can use something like the SaaS Metrics 2.0 Spreadsheet, which is a framework created by David Skok. We also recommend using a tool like ChartMogul if you don’t have a data science team or strong hands-on accounting team to support you on this.
Let’s recap those revenue metric definitions again quickly:
- Starting ARR: The annual recurring revenue you were generating from existing customers at the start of the period.
- New ARR: The additional recurring revenue that you are generating from customers created in this period.
- Expansion ARR: The additional revenue generated from existing customers expanding their accounts – adding seats or going up tiers.
- Churn ARR: Revenue that has been lost from existing customers leaving.
- Contraction ARR: Revenue that has been lost from existing customers downgrading their accounts or removing seats.
- End of Month ARR: The amount of revenue your organization expects to/is contracted to generate from its current cohort of customers over the next 12 months.
Again, if you’re unable to collect these numbers the best solution is to address it with a Marketing Operations program. Estimating these numbers is better than not having them at all, but it’s always best to be as close to reality as possible.
Once you’ve done, your sheet should look something like this:
Step 3: Calculate your Efficiency Metrics
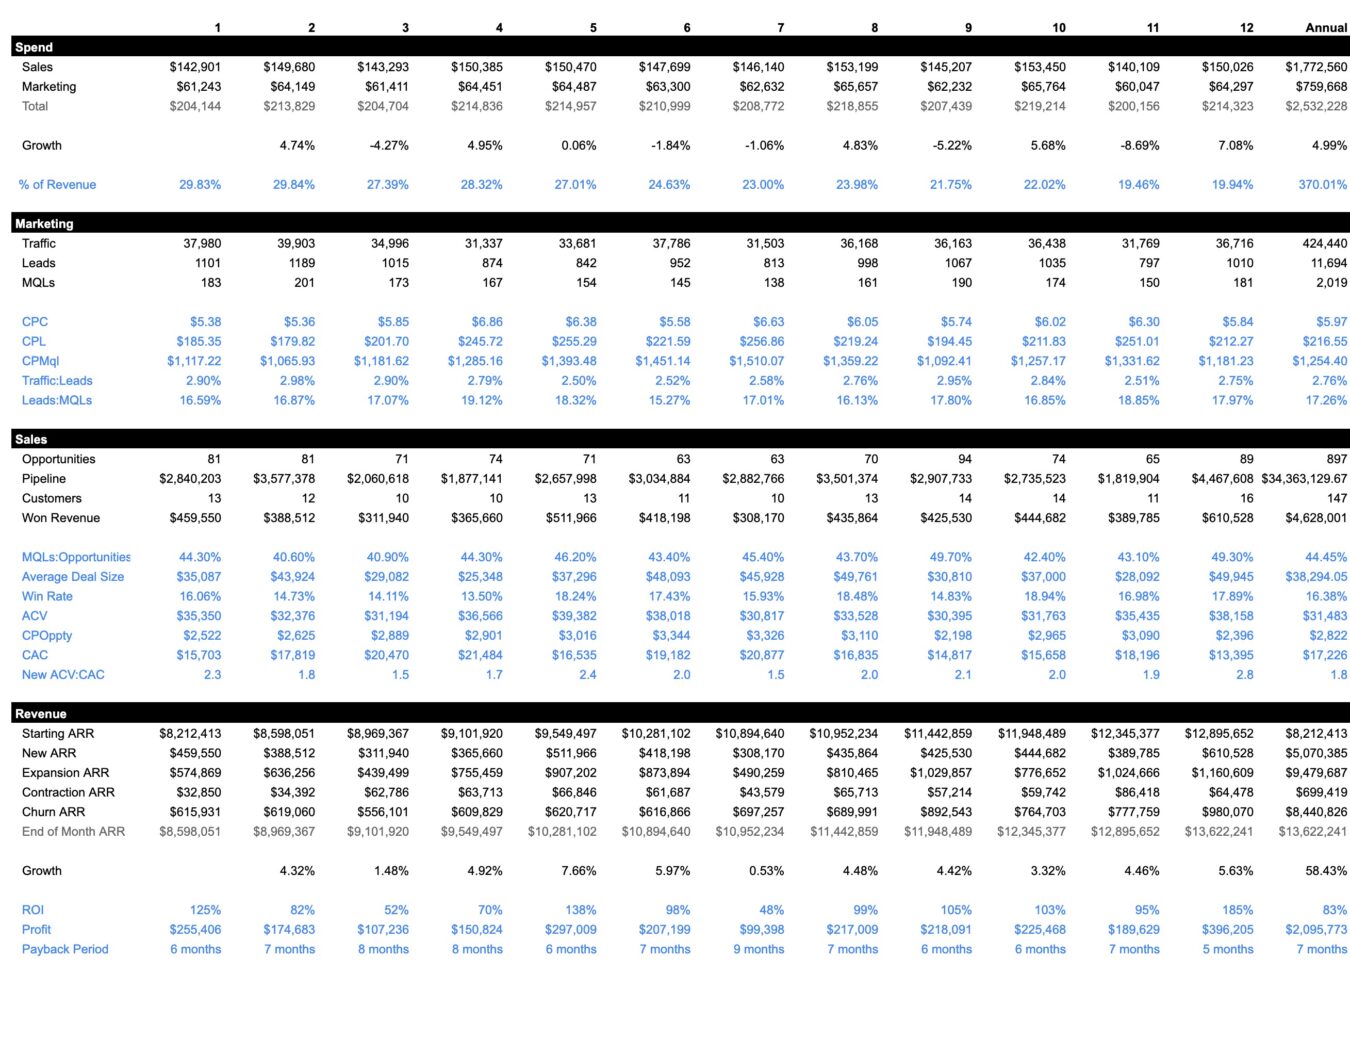
Now that we have a clear picture of your historical performance, we need to calculate your efficiency metrics. Efficiency Metrics, as opposed to Volume Metrics like the ones we’ve already collected, represent the relationship between each aspect of your customer journey.
Calculating your efficiency metrics is a key part of forecasting as they allow us to tie inputs and outputs together, and measure how effective we are at turning inputs into outputs. The way we see it: there’s only really 1 input in sales and marketing: spend. Everything else is optimizing the efficiency of which you turn those leads into revenue.
In our model, efficiency metrics are as follows:
Spend Efficiency Metrics:
- % of revenue: The % of your revenue you’re spending on sales and marketing.
Marketing Efficiency Metrics:
- Website Conversion Rate: The % of user/sessions who convert into leads on your website.
- Lead:MQL Rate: The % of leads that convert into MQLs.
- Cost Per Lead (CPL): The amount of sales and marketing spend to acquire 1 lead.
- Cost Per MQL (CPMql): The amount of sales and marketing spend to acquire 1 MQL.
- MQL:Opportunity Rate: The number of MQLs that convert into Opportunities
- Cost Per Opportunity (CPOppty): The amount of sales and marketing spend to acquire 1 Opportunity.
Sales Efficiency Metrics:
- Average Pipeline Value: Pipeline value is the amount of revenue you expect to generate from open opportunities. This is an average, so the per opportunity value.
- Win Rate: The rate at which Opportunities convert into customers.
- Annual Contract Value: Actual value is the amount of revenue you expect to generate from closed won customers over the next 12 months. This is an average, so the per customer value.
Revenue Efficiency Metrics:
- Expansion Rate: The rate at which your existing customers expand their accounts – adding new seats or going up tiers.
- Contraction Rate: The rate at which your existing customers contract their accounts – removing seats or going down tiers.
- Churn Rate: The rate at which you lose customers. If you have 10 customers and 1 leaves, then you have a 10% churn rate for that period.
- Customer Acquisition Cost: The amount of sales and marketing spend ot acquire 1 customer.
- CAC:ACV: The ratio of annual contract value to customer acquisition cost.
- ROI: The ratio of the profits attributable to your marketing efforts to your marketing costs.
Here’s how this looks in our forecast model:
Step 4: Calculate Your Growth Rates
If you’ve been making adjustments over time, there may be some improvements in the numbers we’ve established.
To make sure we’re factoring these into our forward looking scenarios, we need to calculate what your growth rates have been. There are two ways to do this:
- Calculate your month on month growth rates
- Calculate the growth rate between your first and last month
Due to the volatility in these metrics, they don’t always show a clear picture. However, they should be used to inform your forecasts.
Calculating growth rates is a simple formula – (Current Period – Previous Period) / Previous Period. Here’s how that would look in Google Sheets:

If you’re struggling, you can download our example forecast here:
Get access to your free copy of the B2B SaaS Marketing Funnel Forecast template.
Step 5: Create a “Do Nothing” Scenario
Now we’ve established what your history looked like, we can start evaluating what your future might look like.
To do this, we first create a “Do Nothing” Scenario. A “Do Nothing” scenario establishes what your situation would look like if you:
- Didn’t make any changes to your marketing spend
- Didn’t make any improvements to your marketing efficiency
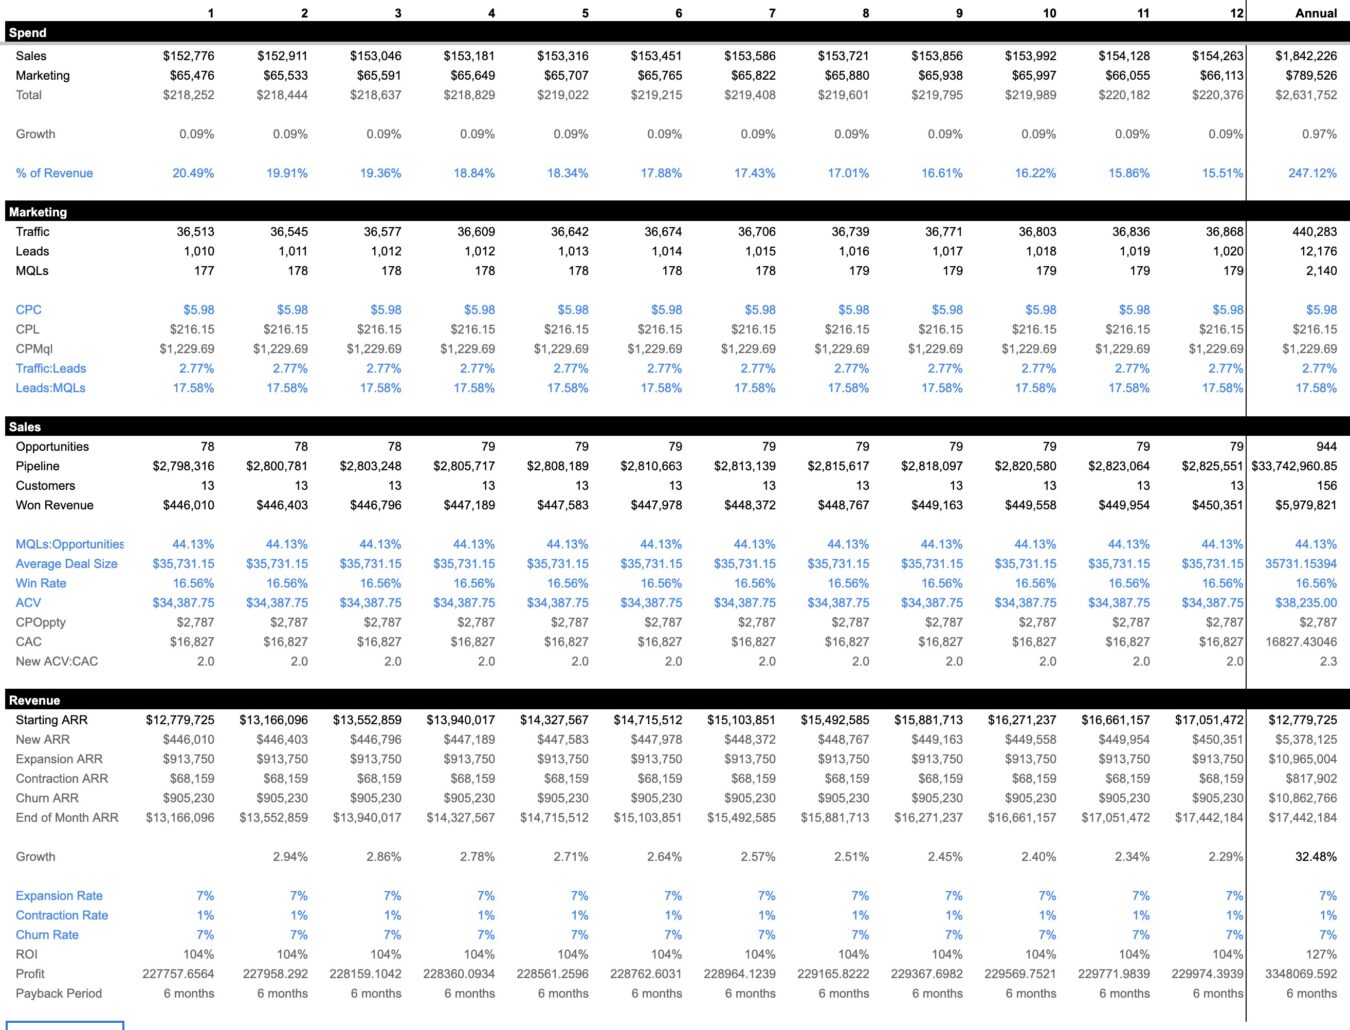
This is achieved by extrapolating your efficiency metrics and factoring in any growth trends in those metrics, and then using those to calculate your volume metrics.
For example, if you evaluated your Cost Per Lead to be $100 when looking at your historical data, and you plan on spending $10,000 in your forecast scenario, then in this scenario you’ll generate 100 leads.
If you also know the following efficiency metrics: Lead to MQL, MQL to Opportunity, Opportunity to Customer Rate and ACV, and you’re going to “Do Nothing” to improve those metrics, then you can forecast all the way to new revenue generated for the year.
What you’ve essentially done is flipped the calculations around: historically, we look at volume numbers and calculate efficiency metrics, but looking forward, we look at efficiency metrics and forecast volume numbers.
Step 6: Forecast Multiple Scenarios Based on Uplift in your Efficiency Metrics
Once we have a Do Nothing Scenario, we’ll typically generate at least three other scenarios:
- Conservative: The very least we’d expect to achieve with our work together, in this scenario we model out very slight improvements.
- Realistic: What we’d realistically expect to see in our work together.
- Optimistic: The best case scenario. If all of the stars align, and we hit the ground running from the start of the engagement, here’s what we might expect.
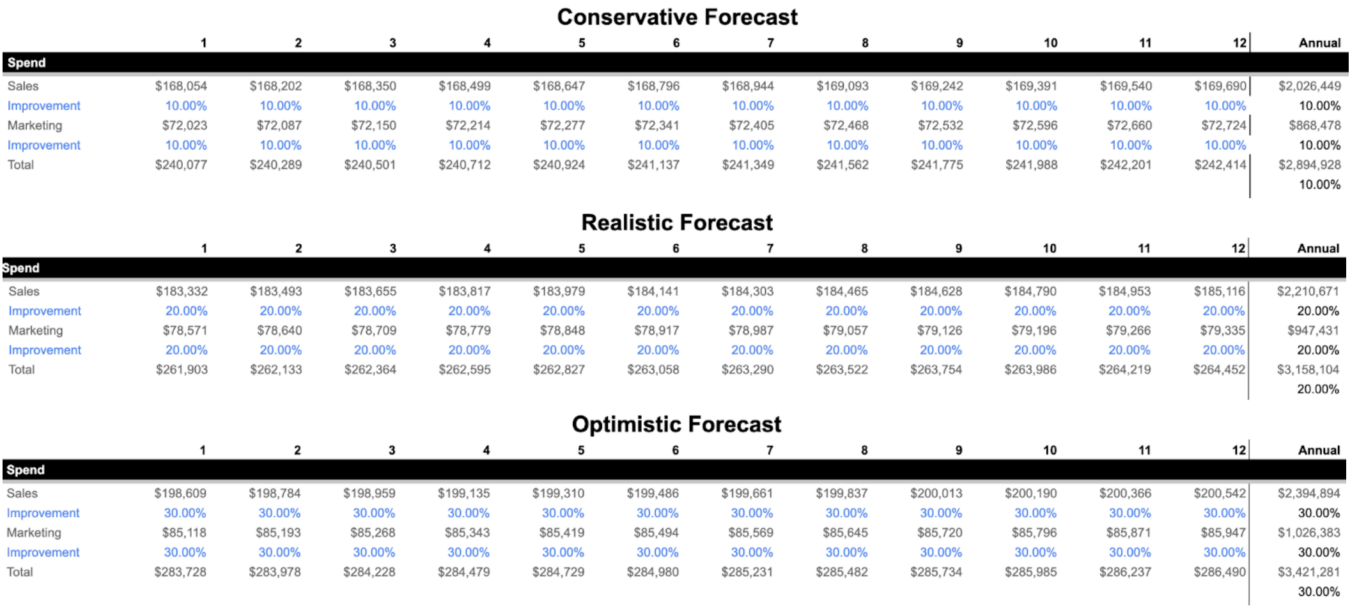
To create these scenarios, we model a percentage uplift of efficiency metrics based on where we expect our work to begin impacting these numbers. For example, we might decide that we’re going to increase our budget for the next year. We might want to evaluate what happens if in 10%, 20% and 30% year-on-year increases.
So we go into our model, and we add those uplifts, distributing them evenly over sales and marketing and months. Our model might look like this:
Now, the real question is: what difference does this make to our business? If you’ve been following along with our template, then you’ll notice that there’s a ‘Presentation’ tab. Here you can see the outcomes based on your different scenarios.
Based on the uplifts in spend only, and assuming nothing else changes (of course we know about factors like seasonality and diminishing returns, which we’ll come into later), here’s what that means to our organization:
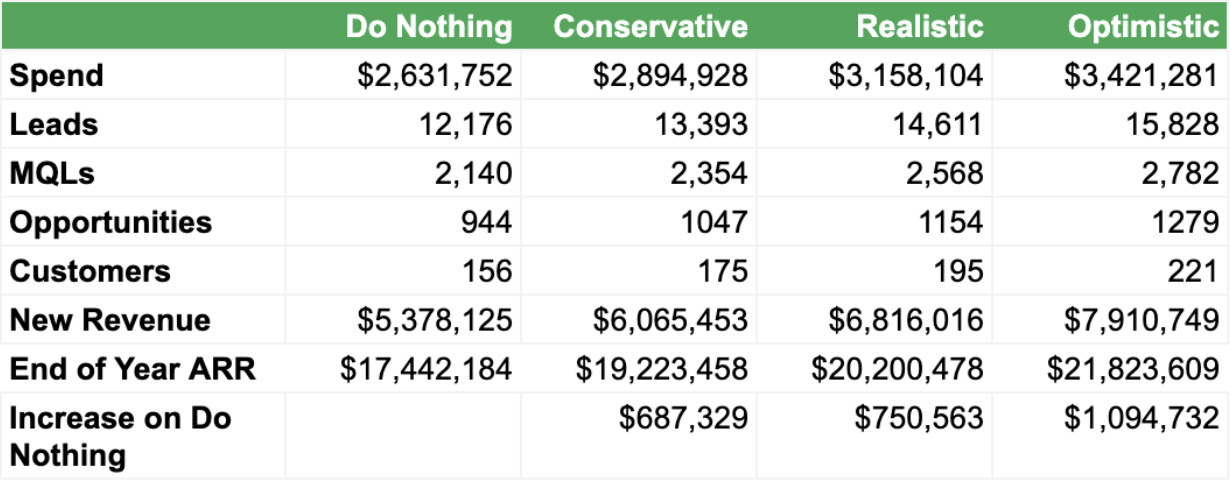
Taking a look at these scenarios, what sticks out to you the most?
For me, it’s the power of a strong sales and marketing funnel. In every scenario, increasing budget puts more into the sales and marketing funnel, which is essentially a machine that sucks in capital and creates ARR.
In this example, that machine is a fine tuned thing of beauty (with especially strong retention and expansion) – you invest an extra $789,529 in sales and marketing, and create an extra $1,094,732 in ARR. Of course, not all businesses are like this – but it really shows how important it is to have a tight sales and marketing machine.
Up until now we’ve only modeled improvements in the spend. But what if we improve the efficiency of which we convert leads into MQLs, MQLs to Opportunities, and Opportunities to Customers?
Let’s model in 1%, 2% and 3% increases as we did with spend, and see what the outcome is.
Here’s what that will look like on our Conservative Model worksheet:
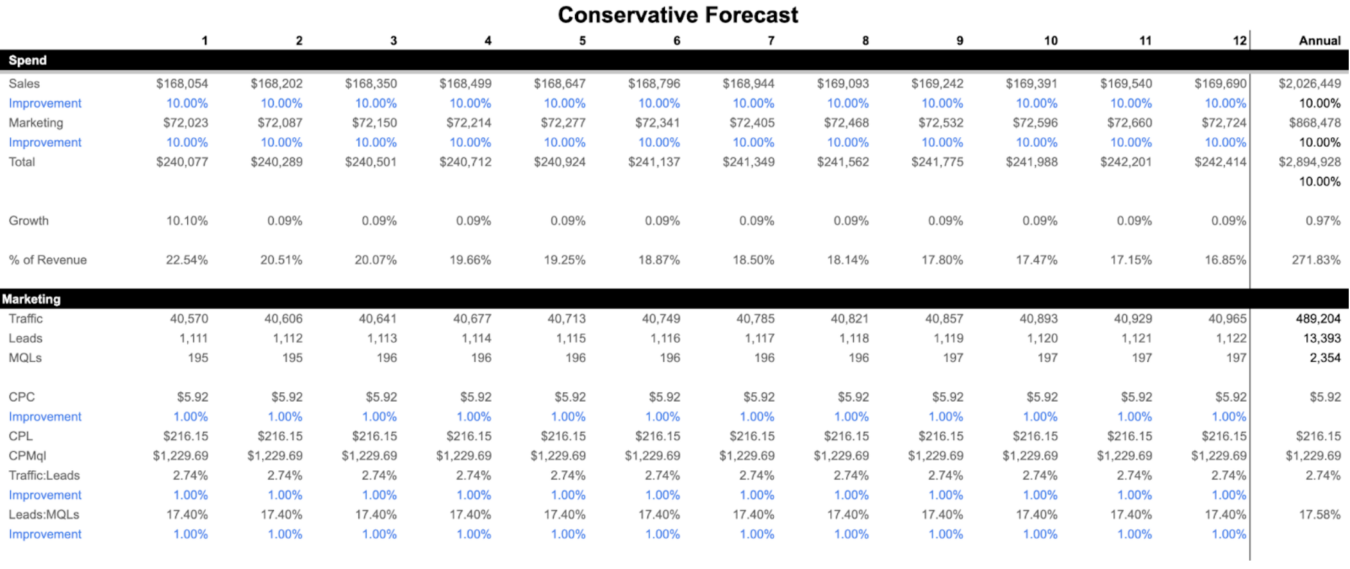
…and here’s the difference it would mean in the performance of our organization:
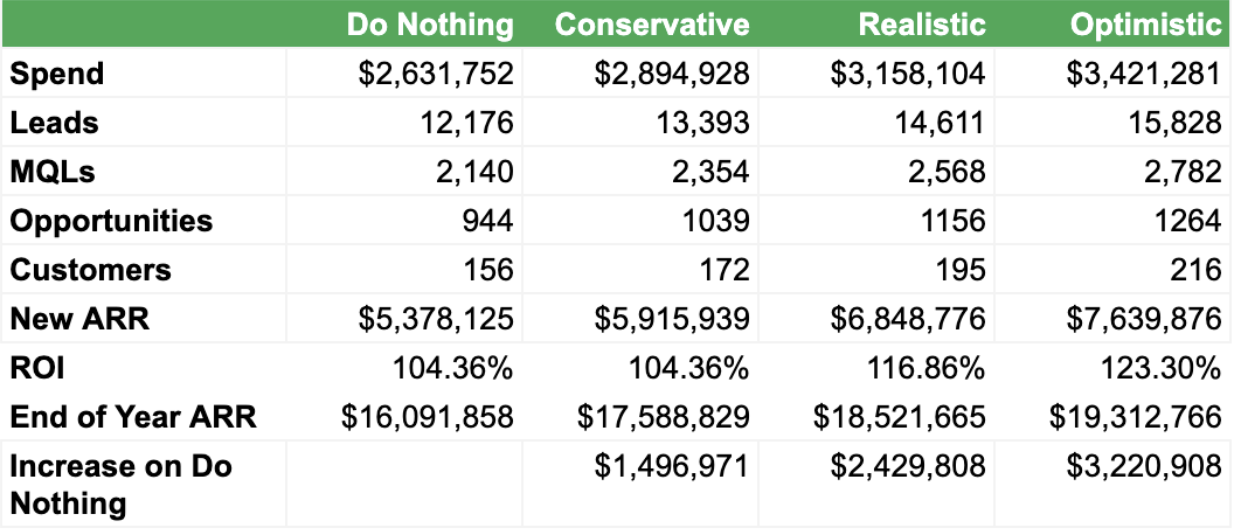
At this stage, you can really begin to see the power of modeling out the customer journey in such a granular way.
There are so many levers we can pull as marketers to improve the business outcomes of our work. In some ways, increasing lead > MQL, MQL > Opportunity and Win Rates are easier than finding new tranches of leads to acquire because they’re areas that are often ignored, leaving huge opportunities for improvement that don’t take months of experimentation to uncover.
The difference a 3% uplift makes – which in real terms is tiny, improving your Win Rate from 16.56% to 17.06% – makes an incredible amount of impact on the ROI of your sales and marketing organization.
If you’re ignorant of the aspects of the customer journey you can impact, you’re ignorant of the power of marginal gains.
The marginal gains theory states that improving and optimizing your performance by a small amount across a number of different areas will lead to much more significant, noticeable improvements overall versus focussing your area on a single area.
If your only point of leverage as a marketer is improving the cost per lead, then your scope of thinking cannot improve beyond that single area of focus. Sure you could break down cost per lead into improving CPM, CTR and conversion rates, but ultimately all of those round-up into the same efficiency metric: CPL.
Generally, it’s much easier for the brain to know how to make a 1% improvement across five areas than a 5% improvement in a single area.
By breaking down the improvements we expect to see overtime, we can give our clients a more realistic understanding of how performance will taper in. It’s rare to see results from month one, but being able to see what’s possible by month 12 helps remove some of the natural ambiguity.
Why This Marketing Funnel Forecast is Effective
Don’t limit the impact marketing can make by limiting their scope to generating leads.
The customer journey is complex with many points of leverage, that if impacted, can create a seismic shift in the performance of your organization.
Focusing on only one point of leverage is like driving in first gear – sure you can move, but your engine will coast at much higher speeds if you shift up to fifth gear.
If you want to create a more accurate forecast, expand your scope of influence as a marketer, and ultimately to dominate your category, you must understand and impact the whole customer journey.
The process of understanding the full customer journey begins with creating a model that is cognizant of each point of leverage, forecasting the impact you can make at each of those points, and putting in the sets and reps to improve how you’re engaging your prospects at each point.
With a more accurate marketing forecast, you’ll be able to create more realistic goals. You’ll also find that your numbers will align better with your CFO’s numbers, which will make it easier to get support for future marketing investments.
As an agency, it also helps us stay aligned with our clients and ensure expectations are realistic so that they know exactly what kind of results they can receive for their investment.
If you’d like to have us create a marketing funnel forecast for your company, reach out to us today for your Free Marketing Plan.
What you should do now
Whenever you’re ready…here are 4 ways we can help you grow your B2B software or technology business:
- Claim your Free Marketing Plan. If you’d like to work with us to turn your website into your best demo and trial acquisition platform, claim your FREE Marketing Plan. One of our growth experts will understand your current demand generation situation, and then suggest practical digital marketing strategies to hit your pipeline targets with certainty and predictability.
- If you’d like to learn the exact demand strategies we use for free, go to our blog or visit our resources section, where you can download guides, calculators, and templates we use for our most successful clients.
- If you’d like to work with other experts on our team or learn why we have off the charts team member satisfaction score, then see our Careers page.
- If you know another marketer who’d enjoy reading this page, share it with them via email, Linkedin, Twitter, or Facebook.