Is Your Current Agency Making You Money? How To Track Marketing Agency ROI
Last updated: February 22nd, 2024
The complexity of user journeys can make it challenging to tie every marketing activity to directly related outcomes.
However, when you dedicate a significant percentage of your budget to an agency to support your marketing efforts it would be irresponsible to pay for activity without a meaningful outcome.
To mitigate risk many marketing agencies measure success by reporting on marketing with vanity metrics, like keyword rankings or ad clicks.
It’s not necessarily wrong to measure vanity metrics, but we strongly believe it’s not the best bottom-line measure of an agency’s value. Vanity metrics can be useful indicators, but it’s not the full story.
Why? Because vanity metrics don’t always correlate with revenue.
So even if the reports from your marketing agency show that the marketing strategy is improving, it may not align with what really matters at the business level, which is the growth in real closed-won revenue trends reported by your finance team.
Unfortunately, this misalignment between your marketing agency’s reports and the finance team’s reports will make it difficult to win buy-in from stakeholders for future marketing campaigns.
To solve this problem, we use a system to tie the buyer journey together so that you can tie real closed revenue to your marketing strategy.
In this post, we’ll show you the exact process we use to align closed won revenue dollars to marketing efforts and how you can build the same reporting process to measure the success of your marketing strategy.
This reporting strategy can help you accurately calculate the ROI of your marketing agency and better align with stakeholders to get buy-in and win budget for future marketing campaigns.
Are you unsure if your marketing is delivering predictable ROI? We can help you diagnose what’s happening and turn your performance around. Reach out out today to get your Free Marketing Plan.
Why We Measure Beyond Marketing Metrics Alone
At the core of our Predictable Growth Methodology is the end goal that we have for all B2B SaaS teams we partner with – to make them unstoppable.
This isn’t only about making their marketing unstoppable. It’s designed to empower their entire organization by ensuring that marketing outcomes drive business outcomes.
We believe this makes us different from most marketing agencies that only measure their success at the marketing level alone.
Of course we still hold high importance on marketing performance, but we add more value by ensuring we also generate the right quality and volume of pipeline for the sales team, to ultimately help the business earn the right customers to hit business goals.
When we start working with our clients, one of the first things we aim to understand and accurately measure is – how much is a customer worth to you and how do you know when marketing contributes to won deals?
Not MQL value, not opportunity value (although both are important to know for measuring pipeline performance), but closed won revenue. Actual dollars in the bank earned from a customer.
Why? Because anything but closed won revenue is not yet tangible ROI. Growing opportunity pipeline is usually a good indicator that your marketing efforts are headed in the right direction, but if those opportunities never turn into paying customers then it means nothing at the business level.
You can’t predictably grow your business and justify investments on anticipated revenue alone.
How We Define The Value of A Closed Won Deal
Before we even begin building a reporting model, it’s important to define the value of a closed deal as this varies depending on the lifecycle of the customer.
For example, when a trail converts into a $29 monthly subscription, is that customer worth only $29? Unless they always churn in 30 days (which suggests there are bigger issues with your marketing and/or product), definitely not.
Here are a few questions we ask to define the value of a closed deal:
- Should we use Deal Size? This can be useful if the customer pays for their entire lifetime value when the deal is won. Yet if they’re on a monthly, or annual program then it’s only a fraction of their actual lifetime value.
- Should we use ACV? This can give you a good measure of the customer’s value of the term of their annual contract or your yearly financials. However, if customers must renew that contract every year and typically stay with you for 5 years, then you’re only measuring a portion (20% in this case) of the total customer value.
In both of these cases, the shared conclusion is in most cases to use lifetime value so that you have a truer measure of what that customer is worth as long as they continue paying you.
For even more accuracy, you can model in churn metrics too for a Gross Revenue Retention (GRR) or Net Revenue Retention (NRR) measure of ROI. However, we’ll focus on just LTV in this post for simplicity.
Why We Use LTV
Many companies use monthly and quarterly reports to measure the ROI of their marketing campaigns, but this is an inaccurate measurement for enterprise B2B SaaS companies for two key reasons.
First, the total revenue generated from that newly closed enterprise client is often much higher than the initial contract value.
For example, the initial contract you sign with a new client may be a 12-month contract for $100,000. However, if that client stays with you for 3 years during its lifetime (a total of three 12 month contracts for $100,000 each), the real value of that new client is actually $300,000.
Therefore, only attributing $100,000 to that closed deal isn’t an accurate representation of the real return earned from your marketing investment.
Secondly, enterprise B2B buying cycles often last multiple quarters, so tying one deal exclusively to that month’s or quarter’s marketing campaigns is inaccurate as the buyer journey actually began many months earlier.
As a result, it’s tempting to double down on the marketing strategies you used during that month or quarter when they may not have been the key drivers that generated the deal.
To solve these problems we use LTV to calculate the real return of your marketing dollars.
Using LTV as the main metric to measure success also holds the marketing agency accountable to long-term success.
In fact, our entire marketing approach is centered around the Predictable Growth Methodology, which is designed to provide cumulative long term value over a time horizon of several years.
By taking this long-term approach, we have the opportunity to lay a solid foundation for each client’s marketing strategy so that they see predictable ROI growth from a consistent investment in their marketing strategy.
Now that you know why we use ROI reports based on LTV, here’s how we actually create them for clients.
What The ROI Report Looks Like
We keep our report visually simple so that clients can see, at a glance, how the revenue from their marketing investment has trended over time.
We intentionally don’t provide a masterclass on SaaS finance because stakeholders need to be able to instantly see the directional ROI of the marketing strategy. We’ve also found that it’s easy for marketing agencies to hide their results (or lack thereof) behind a long list of metrics and numbers.
Yes, the marketing team should still know the specific metrics that contribute to marketing revenue, like CAC, payback period, churn. We still calculate these metrics for all of our clients, and you can see how we do it in your Marketing Funnel Forecasting template.
However, these metrics are all secondary to the bigger question, which is:
What’s the ROI of our marketing investment over the past X years?
To answer this question, we show a simple graph of closed won revenue.
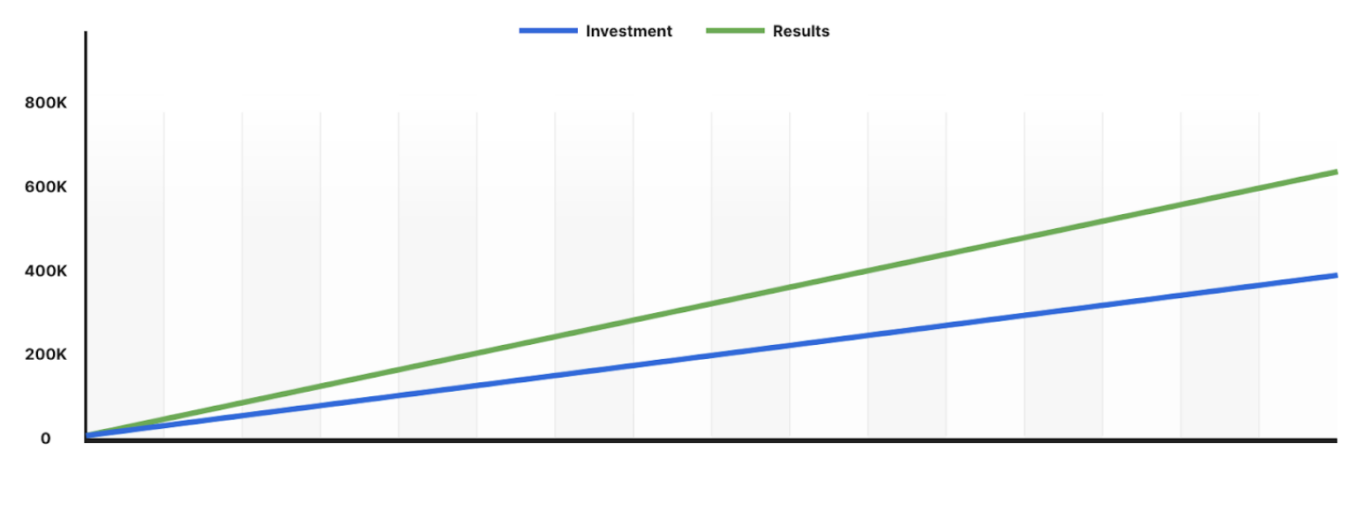
Our goal is to make sure that this line shows compounding growth year over year. The other metrics are designed to help you better understand what strategies contributed to your results, but they aren’t designed to determine the efficacy of your overall marketing strategy.
How We Build ROI Reports
It’s essential that all parties are using the same data set for reporting, so the first step is to assess how you’re currently measuring marketing performance, revenue performance, and the pipeline metrics in between.
If we were to only ask for access to a client’s reports and draw our own conclusions, it would be a complicated, time consuming endeavor that could lead to misalignment. To avoid this risk, we co-create these reports with our clients.
We’ll have a series of conversations and workshops to understand how and why they measure these metrics so we can learn from their experience.
This ensures we’re always using the exact same source of truth so there’s never any confusion when reporting, and the easiest way to avoid that is to talk to each other and build the report together.
For example, when we start working with clients, we want to see that they can track marketing, sales, and revenue performance holistically. If there isn’t strong tracking in place, our first priority is to understand and diagnose that with our clients. We also always check that the data is clean and accurate.
Once you have the right reporting set up with clean, accurate data, you should be able to answer questions like:
- What’s the value of an average customer?
- What’s the LTV of your customer?
By starting with these questions, rather than just looking at vanity metrics like keyword rankings and cost per click, we can accurately attribute closed revenue from marketing efforts.
How We Calculate The ROI Of Our Marketing Efforts
Once you have the data and reporting set up, the calculation for the ROI is actually quite simple.
First, we always measure closed won revenue that came directly from our marketing efforts.
This number always aligns with the money that’s landing in the company’s bank account.
Then, we calculate investment based on the total dollar value of our engagement
So the formula looks like this:

To give you an example of this formula in action, let’s say that over a period of a year, the total revenue generated is $200,000, and the client’s investment with us is $150,000. In that case, the ROI is 133%, meaning the client made $1.33 in revenue for every $1 invested with Powered By Search.
As you can see, this formula always aligns with your finance team’s books, making it an objective, accurate assessment of your marketing strategy’s success.
We’re agnostic on what tool is used to visualize ROI over time, but the reports themselves are typically built out in a reporting tool like Databox, Tableau, or Looker Studio, or you can even do it in a spreadsheet.
What’s A Healthy ROI?
Once you have the data, the next question is usually; what is a good ROI?
There isn’t a simple answer to this question. A ‘good’ ROI is going to vary depending on:
- The trajectory of your marketing and business maturity – is your business primed to scale or still needs to build the foundation?
- The unit economics of your industry and product, such as buying cycles, demo-led vs. trial led, or pricing.
- The stage of your journey with your marketing agency. Expecting a ROI mere hours after signing on to start a program is never going to be realistic
Most agencies use industry benchmarks to determine whether or not the ROI is good, but that isn’t always a great method to measure the efficacy of your marketing strategy for two main reasons:
1. Each company has a different starting place.
Those with more established marketing programs are therefore much more likely to see a strong immediate ROI than those that are already a bit farther behind industry benchmarks. So measuring your ROI against industry benchmarks doesn’t actually reflect your marketing strategy’s growth.
2. Building a strategy that generates a high ROI over a long time horizon (12 plus months) rarely correlates with an immediate ROI (significant spike in one month).
Using industry benchmarks can incentivize marketing agencies to use short term growth hacks to keep up with competitors. Additionally, it can incentivize them to focus exclusively on bottom-of-the-funnel channels to boost short-term conversions. Yet in reality, those channels won’t immediately convert enterprise clients that have a 12 or 18-month buying journey.
As a result, you’ll just waste money.
Instead, we look at the full customer journey and focus on improving each stage of the journey. As a result, our efforts improving the top of the funnel may not produce an ROI until 12 or 18 months later when those leads are finally ready to convert.
Yet over a longer time horizon, you’ll see that this strategy is actually much more effective and sustainable than those focusing on short term growth strategies to keep up with industry benchmarks.
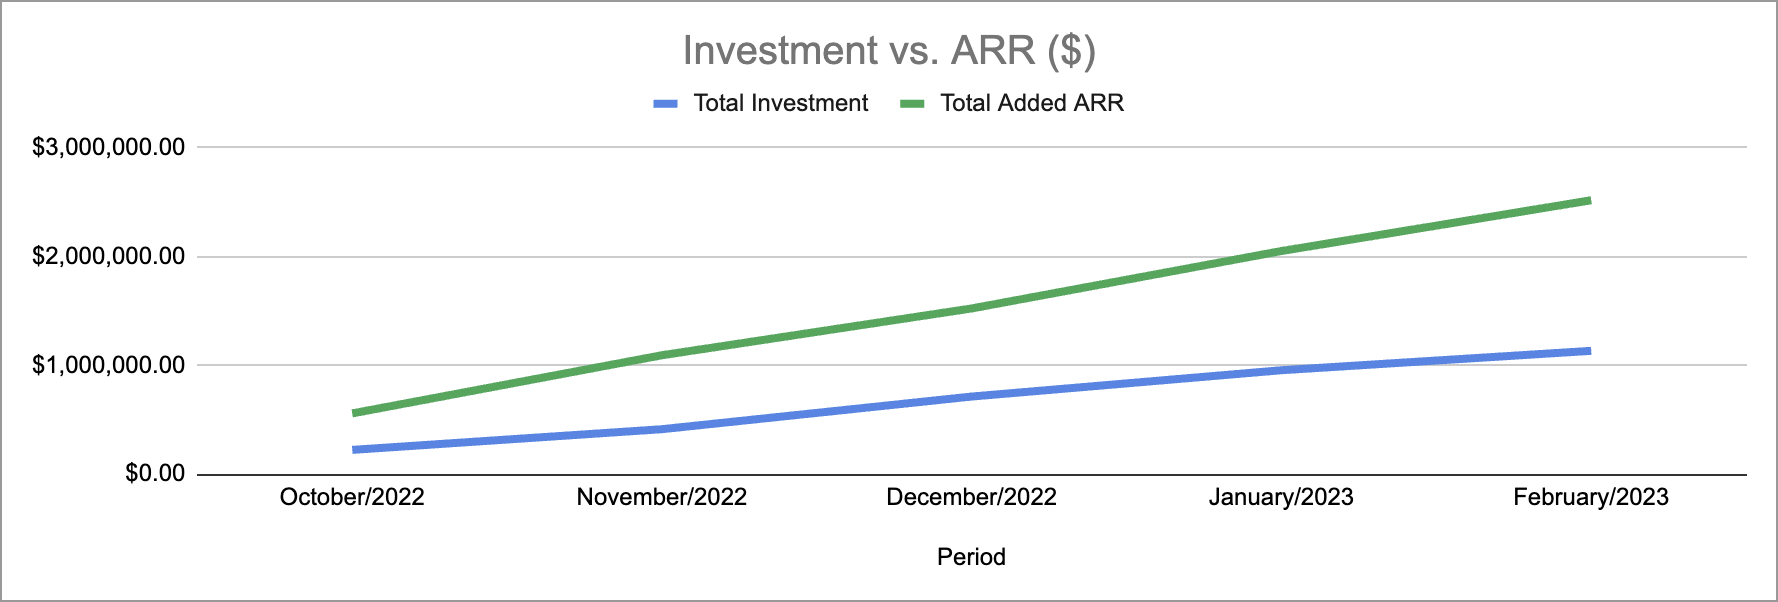
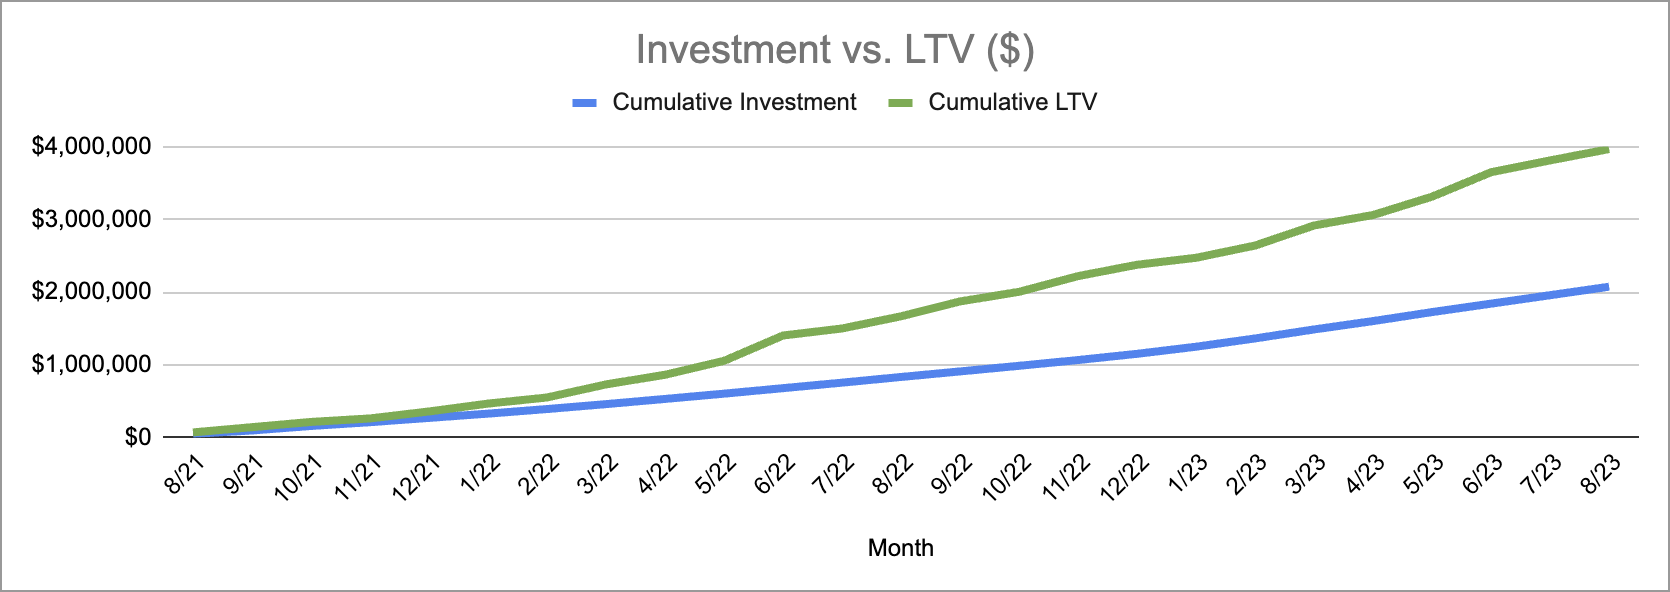
Here’s one example where you can see our client’s cumulative investment remained steady, yet over a longer time horizon, the cumulative LTV increased.

Instead of using generic industry benchmarks or just asking clients to blindly trust us that a negative ROI will turn positive, we use our marketing funnel forecasting template to provide an optimistic, realistic, and conservative estimate of the ROI clients will likely achieve if they work with us.
Therefore, we use this forecast to benchmark the marketing strategy’s success, and it’s a much more accurate measurement as it measures growth based on your current situation rather than comparing it to an arbitrary industry metric.
This approach also helps us set realistic expectations upfront, as it is possible that your ROI will be negative at the beginning of the engagement.
The fact is that our partnerships with our clients are collaborative journeys that ebb and flow over time. “Instant results” is a wonderful promise but that’s rarely the reality.
Typically our first year with clients has high periods, where we see quick results after tackling low hanging fruit, and low periods where there’s doubt as we’re testing to identify what works. This is normal and we’ve covered this topic of what it’s realistically like working with a marketing agency.
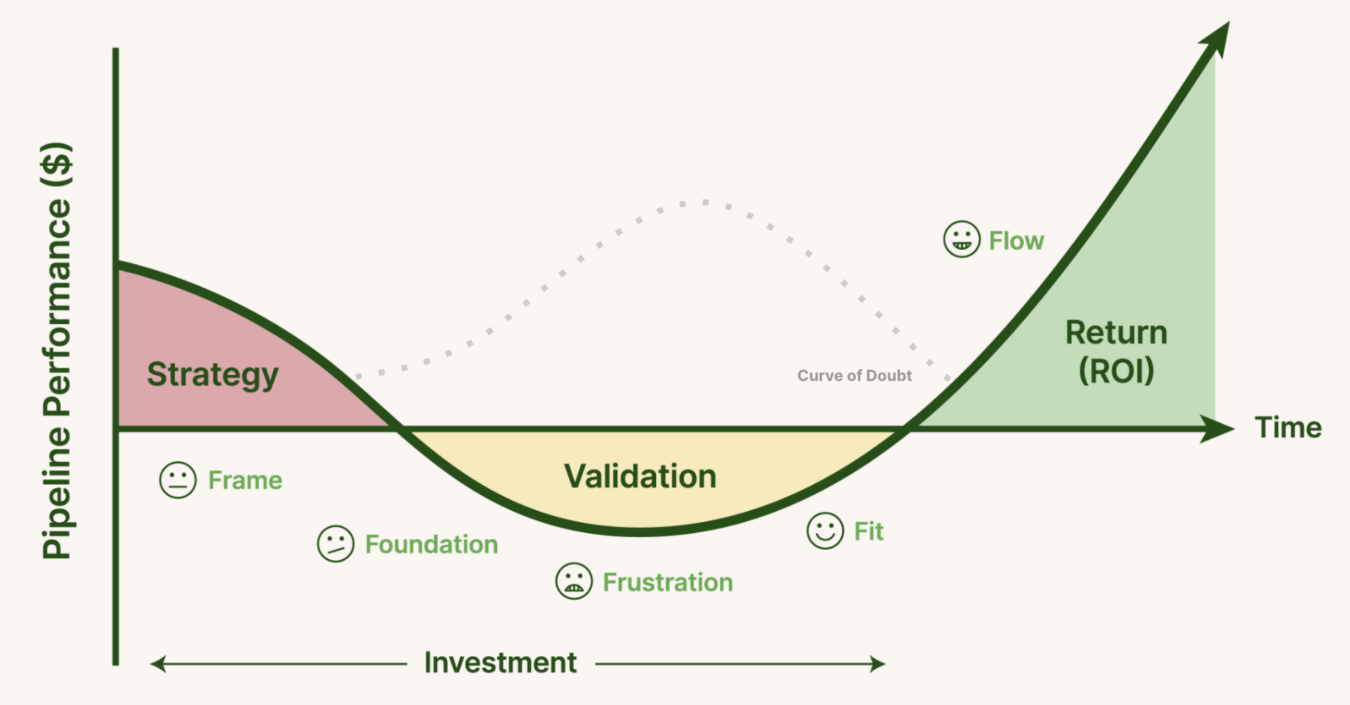
However, if the ROI is negative, we don’t make wild or crazy bets to turn it around.
Instead, we look at what aspects of the strategy are working and then double down on those and cut channels and campaigns that are ineffective.
This approach reduces risk as we’re just refocusing your efforts on what’s already working rather than randomly guessing and testing new approaches. In fact, we even create a hypothesis log for each client and record every significant test we run.
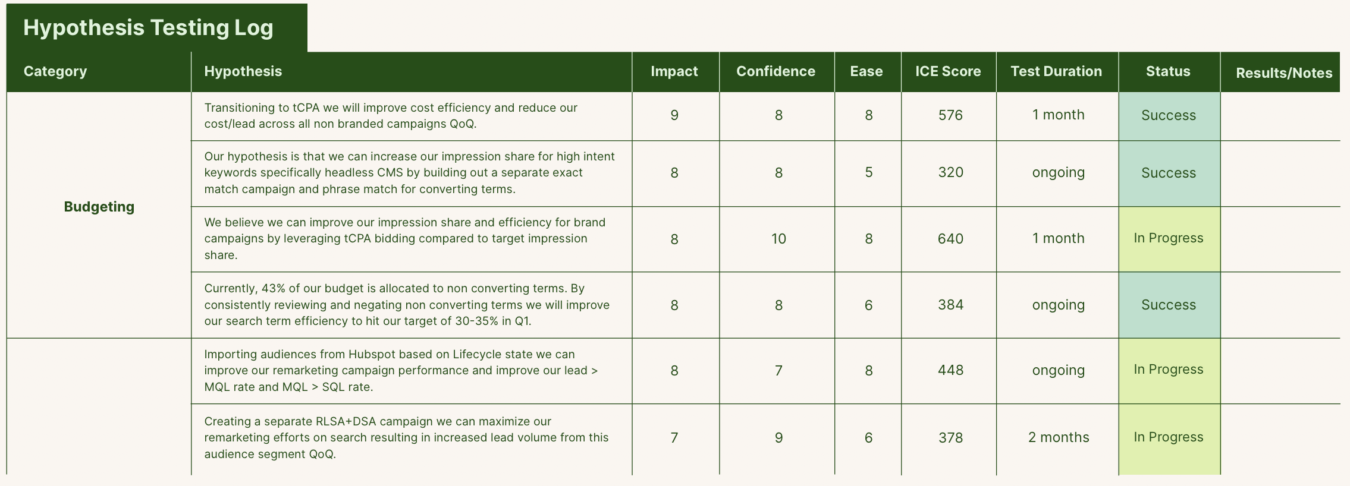
This data set provides more detailed insights on what works and why it’s working to better refine our approach. The hypothesis log also prevents us from making the same mistake twice, which is essential if you need to quickly turn around a negative ROI.
You can see that this cybersecurity client’s growth was very flat for a long time as we implemented this strategy, but by using the hypothesis log and focusing on compounding growth strategies, their growth eventually took off.

Examples of The ROI We’ve Achieved For Our B2B SaaS Clients
Data Governance SaaS
Email Marketing SaaS

Prospect Management SaaS
Start Accurately Measuring The Revenue Your Marketing Strategy Generates
If revenue trends aren’t adding up to your marketing strategy’s calculations, try using the LTV:ROI model to measure your marketing strategy’s success.
If you need more help implementing this reporting system and want to work with a partner that focuses exclusively on long-term growth, reach out to the Powered By Search team today.
When you’re ready, get your Free Marketing Plan here to identify growth opportunities and work with you to create a plan to improve long term growth.
What you should do now
Whenever you’re ready…here are 4 ways we can help you grow your B2B software or technology business:
- Claim your Free Marketing Plan. If you’d like to work with us to turn your website into your best demo and trial acquisition platform, claim your FREE Marketing Plan. One of our growth experts will understand your current demand generation situation, and then suggest practical digital marketing strategies to hit your pipeline targets with certainty and predictability.
- If you’d like to learn the exact demand strategies we use for free, go to our blog or visit our resources section, where you can download guides, calculators, and templates we use for our most successful clients.
- If you’d like to work with other experts on our team or learn why we have off the charts team member satisfaction score, then see our Careers page.
- If you know another marketer who’d enjoy reading this page, share it with them via email, Linkedin, Twitter, or Facebook.