How to Diagnose a Sudden Drop in Leads in B2B SaaS
Last updated: September 1st, 2021
July 2021 was one of the worst months in recent memory for B2B SaaS marketers. Almost everyone in my network was sharing horror stories about sudden drops in leads.
It brought up the same set of questions for many businesses:
- What led to this?
- How long will this last?
- Is this a systematic failure or a short term problem that will recover quickly?
You’d think that most B2B SaaS companies would be prepared to answer these questions. They’d know the common reasons that can lead to periodic drops, and have a defined process to investigate the source of these issues. It turns out that many don’t.
Many companies were left feeling completely in the dark. They were unsure of which data to look at, or where to even start. The most they could really do was ask other people if they were seeing the same thing.
While that’s useful to an extent, it leaves companies without agency or certainty in how to figure out if the drop is a result of short term fluctuation or a larger technical issue.
To help marketers in my network, I wrote a Twitter thread explaining the process I use when I’m in this situation. It consists of 2 basic things:
- Understanding the most common potential reasons for seeing a sudden drop in leads
- Understanding how to figure out which is the most likely source of the issue in your particular situation
If you have a process for this, you’re more likely to catch larger technical issues that might be the source of the problem, and fix them before they become really damaging. You’ll also have a better idea of when drops are simply a result of seasonality or holiday periods — and thus not a cause of major concern.
In this post I’ll walk through the same 5 common reasons for seeing sudden drops in conversions, and expand on each of them in more detail.
At Powered By Search, we help B2B SaaS businesses achieve predictable growth through SEO and paid media. To learn more, schedule a Free SaaS Scale Session.
1. Seasonality
If you’ve ever worked in Europe, you’ll know that between May and September, it’s harder to close deals (unless you’re selling beach towels).
That’s seasonality.
Every country and industry has periods in the year where people buy less stuff. This is particularly relevant for B2B SaaS. When people are taking their kids on summer vacations, there are less people at work shopping for business software products.
You shouldn’t just assume this is the problem if you see a massive drop in leads during July. You need to dig into your analytics to ensure there isn’t a major technical problem happening. But if you don’t find any deeper technical issues, it’s certainly possible that seasonality is the culprit.
This is a short term problem that’s likely to recover in 1-2 months.
If you want to try combatting seasonality, you can ramp up your marketing activities in the period leading up to the drop. If you can increase conversions in the months prior to your seasonal low period, you can compensate for when that drop comes.
Here’s an example of how you might approach this:
- Step 1: Look at your Acquisition > Overview report in Google Analytics. Select your conversion goal. Select the month of July as your date range, and compare that to the previous period.

- Step 2: Look at the percentage difference in goal completions between the 2 months.
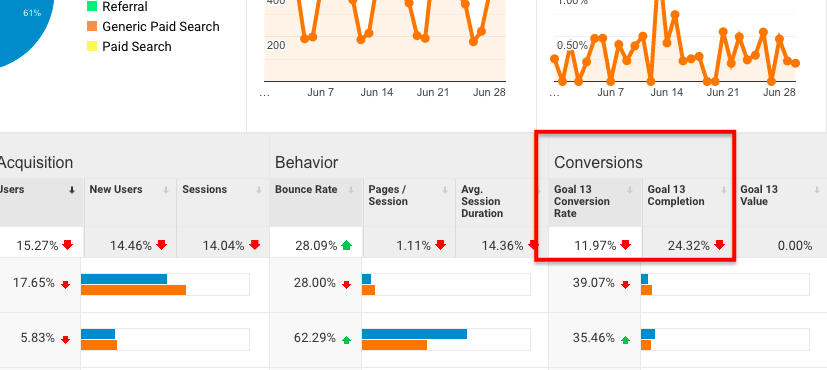
- Step 3: Work out what that percentage drop equates to in absolute numbers of leads. (E.g. If you average 100 leads per month and you’re down 25%, you’d be down 25 leads in July).
- Step 4: Next year, increase marketing activity (e.g. investment in PPC) in the 2-3 months prior to (or following) the seasonal dip sufficiently such that you can make up that number of absolute leads over the course of those surrounding months.
2. Holiday periods
We all know Christmas is a slow time in the Western world. But it’s not the only time holiday periods can cause sudden drops in leads.
In July, for example, there are 5 holiday days for B2B SaaS companies selling to North America because of long weekends for Canada Day and July 4th.
Because B2B SaaS is sold across borders, if you don’t take into account regional holidays like this, you can easily miss when holiday periods are the source of a sudden drop in conversions.
The approach to compensating for these holiday drops is the same as I described above for seasonality (i.e. ramping up marketing efforts in the months prior or after). But how can you be sure that a drop is commensurate with the number of holiday days?
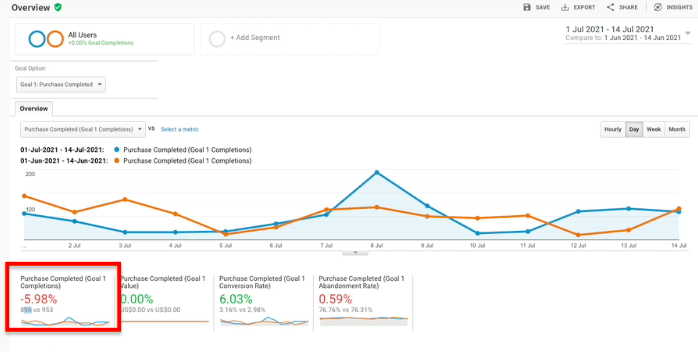
First, go to Conversions > Goals > Overview in Google Analytics. Then select the conversion goal you’re tracking and the comparison date range as you did in the example of seasonality above.
Look at the percentage difference in conversions. In the Google Shopping test account, for example, they saw a 5.98% decrease in conversions in July.
Then, there’s a simple formula you can use to get perspective on the drop you’re seeing:
(Number of holiday days in your market / total number of days in month) x 100)
If you were doing this for July in North America it would be:
(5 / 31) x 100 = ~16%
Note: Conversions continue to happen on weekends in SaaS (particularly self-serve), so I’ve included the weekend days associated with each holiday in this example.
To continue with the Google Store example, if you only saw a 6% drop in conversions with 16% fewer working days, you wouldn’t be feeling too bad about that.
If you saw a drop in conversions that was closer percentage-wise to the percentage of fewer days, you could safely assume that the drop was due to the holiday period.
And if you saw a drop in conversions that was significantly larger than the percentage of fewer days, then you’d want to continue investigating for deeper issues.
3. Decreased traffic through main channels
The next most likely cause of a slower month is that your traffic is just down. If your traffic is down, even if you maintain your conversion rate, you’re still going to see a drop in conversion volume.
Every channel has a different process for investigating this as the source of your leads drop. Below I’ll cover how to do this for organic search and PPC.
Investigating organic traffic as the source of a leads drop
To compare organic search traffic, you could use either Google Analytics, Google Search Console, or an SEO tool like Ahrefs.
In Analytics, it’s useful to look at the differences in “New Users” via organic search. You can view this by going to Acquisition > Overview. Then selecting the date range comparison as we’ve done above.
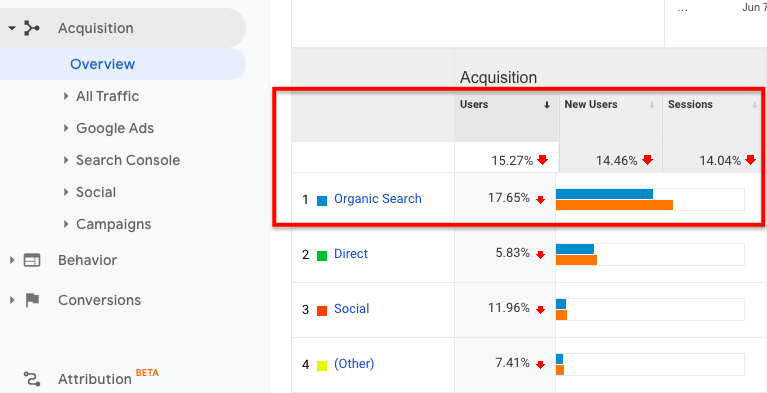
In this example you can see this account saw a 14.46% decrease in organic traffic between June and July. That can be matched up to the percentage decrease in conversions to get some perspective on whether or not that may be one of the sources of the drop in leads.
If you want to dig deeper, you can look at an SEO tool to factor in clicks and keyword positions. For example, in Google Search Console you could go to Search Results > Select “Total clicks” and “Average position” > Select date range comparison:
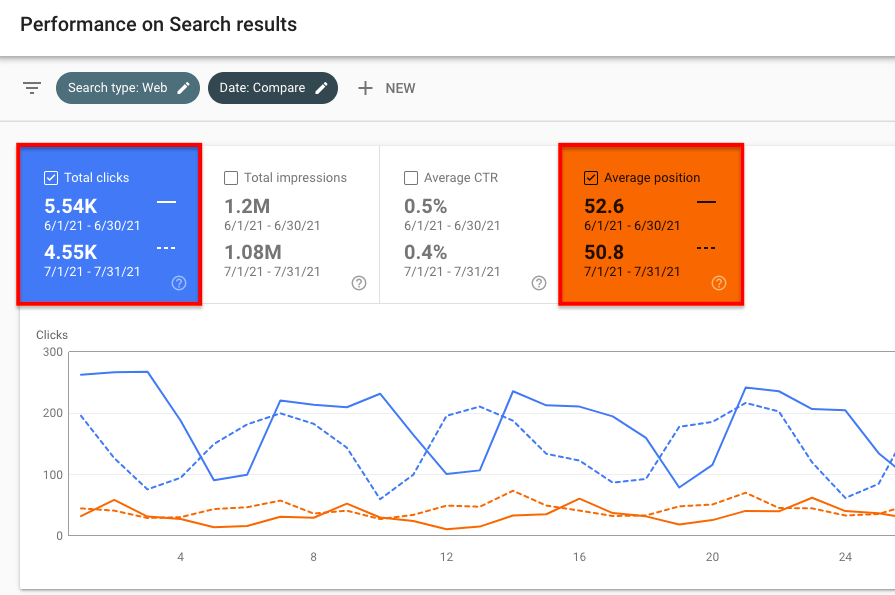
In this example, this account saw about 1k fewer clicks in July, despite having slightly improved average ranking position. The key indicator here is a roughly 20% decrease in clicks via organic search.
Similar to how I described above, you could compare this to the percentage drop in conversions to see how they match up. That will give you insight into whether a drop in organic traffic may have been the leading source of your leads drop.
Investigating paid traffic as the source of a leads drop
Investigating paid traffic as the source of a leads drop is more complex and dynamic than other channels because consistent PPC optimization is key to getting great results.
Metrics such as budget, average cost per click, search impression share, and clicks can often change and evolve rapidly from week to week. For example, your PPC team might be making adjustments to respond to rising click costs. Or, a new competitor may have entered the space and begun to affect your rankings.
With that said, there are some baseline comparisons you can look at to see how results differ from month to month. For example, in Google Ads you can go to Campaigns > Select Date Range Comparison:
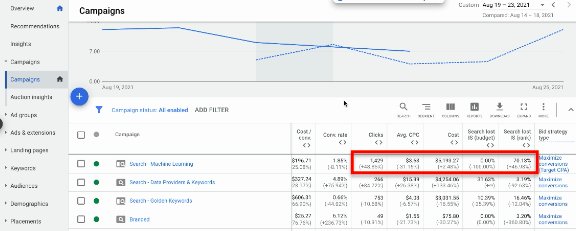
In particular you should look at:
- The percentage share lost to budget
- The percentage share lost to rank
- The percentage changes in average CPC
If you see significant changes in results month over month, you should investigate further through Google Analytics and your ads accounts to confirm if this may be the source of your leads drop.
Note: When investigating paid traffic, you’d want to take the equivalent steps in each of the platforms where you’re running ads.
4. Decreased on page conversion rate
Another potential reason for a sudden drop in leads is a decreased on page conversion rate. If you’ve made updates to key pages on your site recently, updated page design and copy can have a significant impact on conversions.
For example, at my previous company, we had a landing page that was converting around 4%:
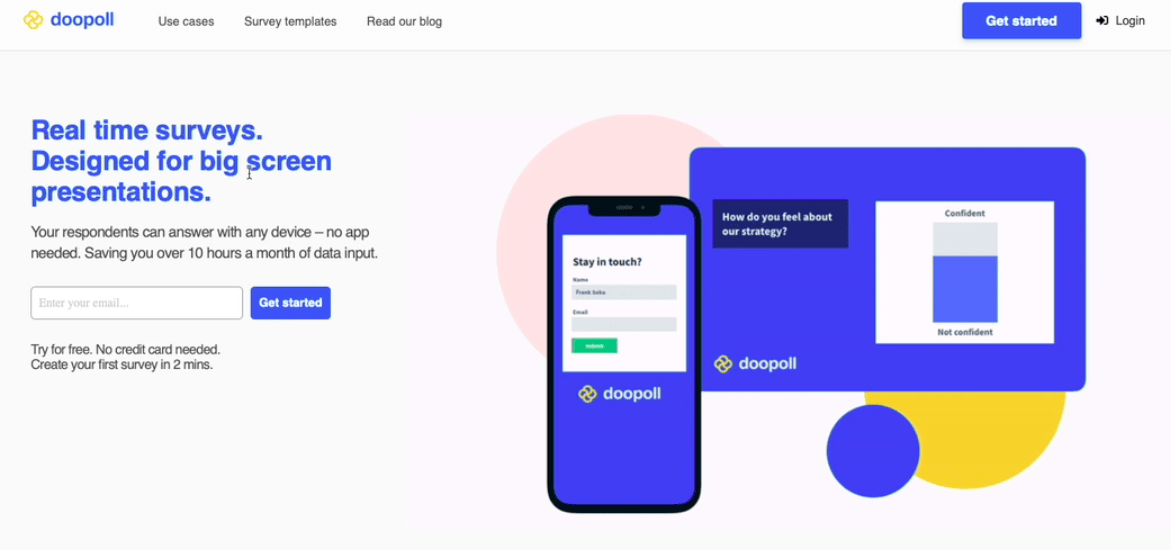
The message was “Real time surveys. Designed for big screen presentations.” It was focused on our customer segment of event organizers.
When we updated the page design and copy, the page began converting at 14%:
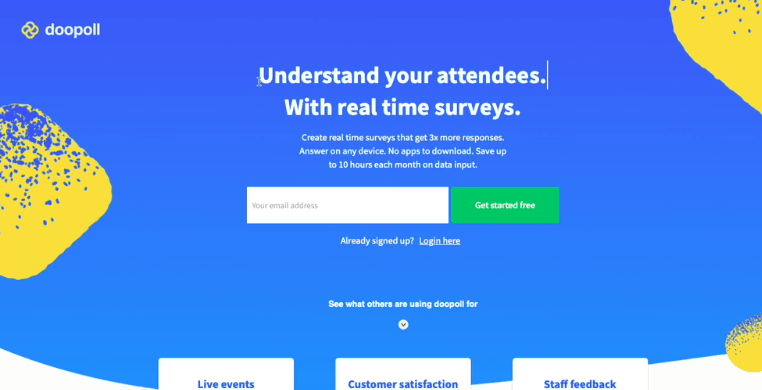
This is the level of impact that relatively simple site updates can have on conversions. While in this case the update led to an increase in conversions, the inverse is also very common.
Often SaaS businesses can make updates to key landing pages, and without realizing, that page’s conversion rate can drop off significantly. So this is another key area to investigate when you see a sudden drop in conversions.
To investigate if this has been the source of a leads drop, look back at your last month and ask yourself what updates you’ve made to the pages where most of your conversions come from.
If you’ve changed any of the copy, design or images on your page, it’s possible that the new version just isn’t landing.
Consider rolling back changes for the rest of the month to see whether your conversion rate improves.
If the rate improves, think twice before updating the page again. If it doesn’t, you’d better continue investigating to identify the real source of the problem.
5. Technical problems for conversion rate
Occasionally, you’ll have made a more fundamental change to your SaaS website that impacts your conversion rate.
If your developer or designer has pushed new code recently, make sure your conversion forms are clickable and submittable on the key pages throughout your site. Sometimes, a very small coding issue can be the source of a big drop in conversions.
Investigating this as the potential issue is similar to the process described above for on page conversion. Begin with checking what updates have shipped to key pages in the past month.
Common examples of technical problems include:
- Form submit button isn’t correctly wired up
- Pages are struggling to load — users may be seeing a white window and bouncing — this is particularly common if you have previously run A/B tests
- Browser based issues may mean that key page elements are hidden to visitors
- Someone accidentally deleted the signup form (this has actually happened to me)
One approach to investigating this further is to watch user sessions on Hotjar to see what users are doing and where the snags are happening. Look out for things like:
- Users not scrolling beyond the fold
- ‘Rage clicks’ where a user is clicking multiple times in frequent succession — a sign that something is broken or not behaving as the user expects
- Users are moving their cursor aimlessly — you’re attracting unqualified visitors (they have no idea what they’re there to do)
- Users are moving their cursor rapidly — you’re confusing the user with your layout or messaging and they’re moving their cursor aimlessly while looking for the next move
In addition, if you have event tracking, look at event level data for things like ‘submit button clicked’ or ‘start trial clicked’ to see whether there has been a drop off.
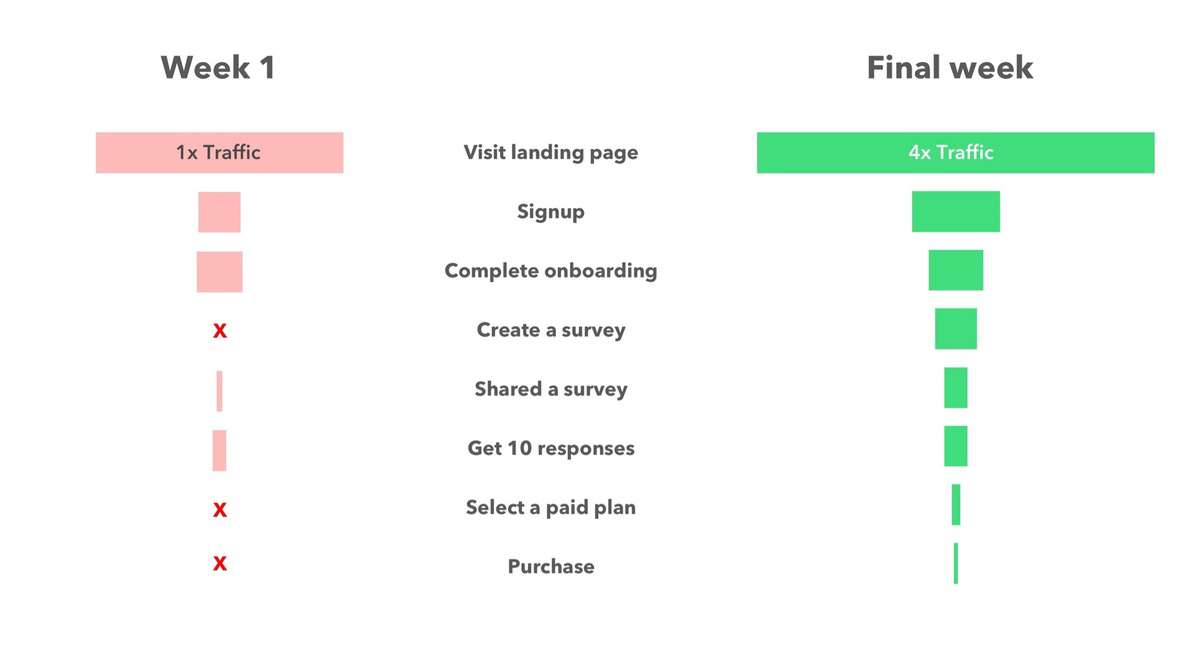
The image above shows the steps in a funnel we worked on mapped out. The length of the bars shows the percentage of people who progressed between steps during the period of each week. The left and right funnels show how the progression changed over time.
We started by working on the stages where zero people converted and then monitored the impact, making changes in response to improvements in conversion.
Lastly, look at your site on different browsers to ensure that there’s not a browser specific design issue hiding key elements. And run a page load time test — if your site is running slow, you may be losing visitors’ attention.
Conclusion
Periodic drops in leads are inevitable in B2B SaaS marketing. When they’re significant, it’s essential to have a defined framework for investigating the source of the problem.
Companies who have this are quicker to catch technical issues before they lead to a huge loss of revenue and missing quarterly targets. They also have peace of mind when drops in leads are a result of natural fluctuation like seasonality and holiday periods.
By following the process I’ve laid out above, you’ll be better off than many companies out there who don’t know where to start when these situations come up.
If you’d like to learn more about how we help B2B SaaS businesses grow through paid media and SEO, schedule a Free SaaS Scale Session to chat with someone on our team.
What you should do now
Whenever you’re ready…here are 4 ways we can help you grow your B2B software or technology business:
- Claim your Free Marketing Plan. If you’d like to work with us to turn your website into your best demo and trial acquisition platform, claim your FREE Marketing Plan. One of our growth experts will understand your current demand generation situation, and then suggest practical digital marketing strategies to hit your pipeline targets with certainty and predictability.
- If you’d like to learn the exact demand strategies we use for free, go to our blog or visit our resources section, where you can download guides, calculators, and templates we use for our most successful clients.
- If you’d like to work with other experts on our team or learn why we have off the charts team member satisfaction score, then see our Careers page.
- If you know another marketer who’d enjoy reading this page, share it with them via email, Linkedin, Twitter, or Facebook.